
How to Look Up San Bernardino County Jail Population Data
The primary source for San Bernardino County jail population data is the Sheriff's Detention and Corrections Bureau. The Bureau publishes facility-level capacity and average daily population on its corrections pages and updates booking counts each year. The live inmate locator at the Sheriff site refreshes throughout the day, but it shows person-level records, not aggregate counts. For roll-up numbers across the four jails, the Bureau's annual figures are the official source.
The Bureau of Justice Statistics adds a second layer through its Annual Survey of Jails. BJS reports midyear and year-end counts at the county level, with a one to two year lag. The Vera Institute pulls county data from BJS and the Census of Jails into a long-running trend dataset, and Prison Policy Initiative reports state-level California context. None of these sources lists hour-by-hour counts, so the Sheriff dashboard remains the most current view of who is in the jail right now.
San Bernardino County Jail Capacity Overview
The county jail system holds 7,400 rated beds across four main adult facilities. The system also runs a county-scale booking pipeline: about 85,000 bookings each year, with West Valley alone moving 50,000 to 60,000 bookings and releases. Central Detention handles federal contract holds in addition to county inmates. High Desert serves the desert region, and Glen Helen runs rehabilitation programs alongside a separate female housing unit. The table below shows the published rated capacity and the typical population figures the Sheriff has released.
| Facility | Rated Capacity | Reported Population |
|---|---|---|
| Central Detention Center | Not published | 200+ federal, 600+ county; 20,000+ processed yearly |
| Glen Helen Rehabilitation Center | 1,446 (max); 326 (female unit) | ADP 800; female ADP 250 |
| High Desert Detention Center | Not located in source pages | Not published |
| West Valley Detention Center | 3,347 | 50,000-60,000 bookings/releases yearly |
Total system capacity sits at 7,400 beds when the four facilities are combined and rounded as the Sheriff reports it. Not every facility publishes a current daily count on a public dashboard, so the system-wide ADP of 5,000 is the most reliable number for planning and reporting.
Average Daily Population
The system-wide average daily population in San Bernardino County jails is about 5,000 inmates. That figure comes from the Sheriff's Detention and Corrections Bureau. It is a rounded number that covers all four main adult facilities. The county does not publish a month-by-month ADP series on its public pages, so year-over-year change must be drawn from BJS Annual Survey of Jails data once it is released.
The ADP runs well below the 7,400-bed rated capacity. That leaves headroom for federal contract holds at Central and for short-term booking surges at West Valley. Glen Helen contributes an ADP near 800 in the main unit and 250 in the female unit. West Valley carries the largest share of county inmates day to day, in line with its 3,347 rated capacity and its volume of bookings and releases.
Demographic Breakdown
The Sheriff has not published a current five-year demographic breakdown of the San Bernardino County jail population by race, age or sex. That is a known research gap. For context, statewide California jail numbers from the Bureau of Justice Statistics and the Vera Institute show a population that skews heavily male and reflects state-level racial patterns. The table below uses California-level reference data from public BJS and Vera reports as a stand-in until the county releases its own breakdown.
| Group (California reference) | Approximate share of jail population |
|---|---|
| Male | ~88% (state-level BJS) |
| Female | ~12% (state-level BJS) |
| Hispanic or Latino | ~46% (state-level) |
| White (non-Hispanic) | ~26% (state-level) |
| Black or African American | ~17% (state-level) |
| Other / unknown | ~11% (state-level) |
These shares are reference points. They are not San Bernardino County counts. The county's Glen Helen female housing unit carries a rated capacity of 326 and an ADP near 250, which is consistent with a female share in the low double digits at the local level.
Pretrial vs. Sentenced Population
San Bernardino County has not published a current pretrial versus sentenced split on its public pages. That is a research gap. National data from the Bureau of Justice Statistics shows that roughly two-thirds of the people held in local jails across the United States are pretrial. The share has held near that level for several years. The table below presents the national average as a working reference until the county publishes its own split.
| Status (national reference, BJS) | Approximate share |
|---|---|
| Pretrial (not yet convicted) | ~66% |
| Sentenced or held on other status | ~34% |
California has used pretrial reform tools over the past few years, including changes to bail and risk assessment. Local mix may differ from the national average. The Sheriff's bail page, the Public Defender pretrial team and Superior Court data could narrow this gap if pulled together.
Misdemeanor vs. Felony Population
The county does not publish a current misdemeanor versus felony breakdown for the jail population. The Sheriff lists charge codes on each inmate profile in the locator, but the aggregate split is not posted. Vera and BJS show that California county jails have shifted toward more felony and longer-stay populations since 2011 realignment under AB 109, which moved many lower-level state prison sentences to county jails.
That shift is part of why San Bernardino County keeps 7,400 beds and runs an ADP near 5,000. AB 109 sentences can run multiple years inside the jail rather than at a state prison. The result at the county level is a population mix with a meaningful share of longer felony sentences, alongside the usual pretrial and short-stay misdemeanor cases.
Mental Health and Medical Population
The Sheriff has not posted a single number for the share of the jail population receiving mental health or medical care. The Detention and Corrections Bureau does run programs that point to a real and steady caseload. Glen Helen carries a Rehabilitation Center label, not a basic detention label. The Sheriff Corrections release page treats medical, mental health and structured release plans as case-by-case decisions, with release timing handled individually rather than on the standard 6 a.m. to 6 p.m. window used for sentence-completed releases.
The Superior Court runs a Mental Health Collaborative Court that handles qualifying defendants with mental health conditions. The Public Defender represents people in civil commitment matters in addition to criminal cases. None of those programs publishes a public count of jail beds in use, so the precise medical and mental health share remains a gap. For research, the BJS Census of Jails has occasionally published special data on mental health screening and treatment, and Vera reports on jail health staffing.
National and State Context
Three federal and nonprofit sources frame the national and state context: the Bureau of Justice Statistics, the Vera Institute incarceration trends dataset and Prison Policy Initiative. BJS runs the Annual Survey of Jails and the Census of Jails. Vera turns BJS data into county-level charts that go back to 1970. Prison Policy reports California-wide totals and state-level rates per 100,000 residents.
The Bureau of Justice Statistics publishes the underlying jail population series at bjs.ojp.gov.
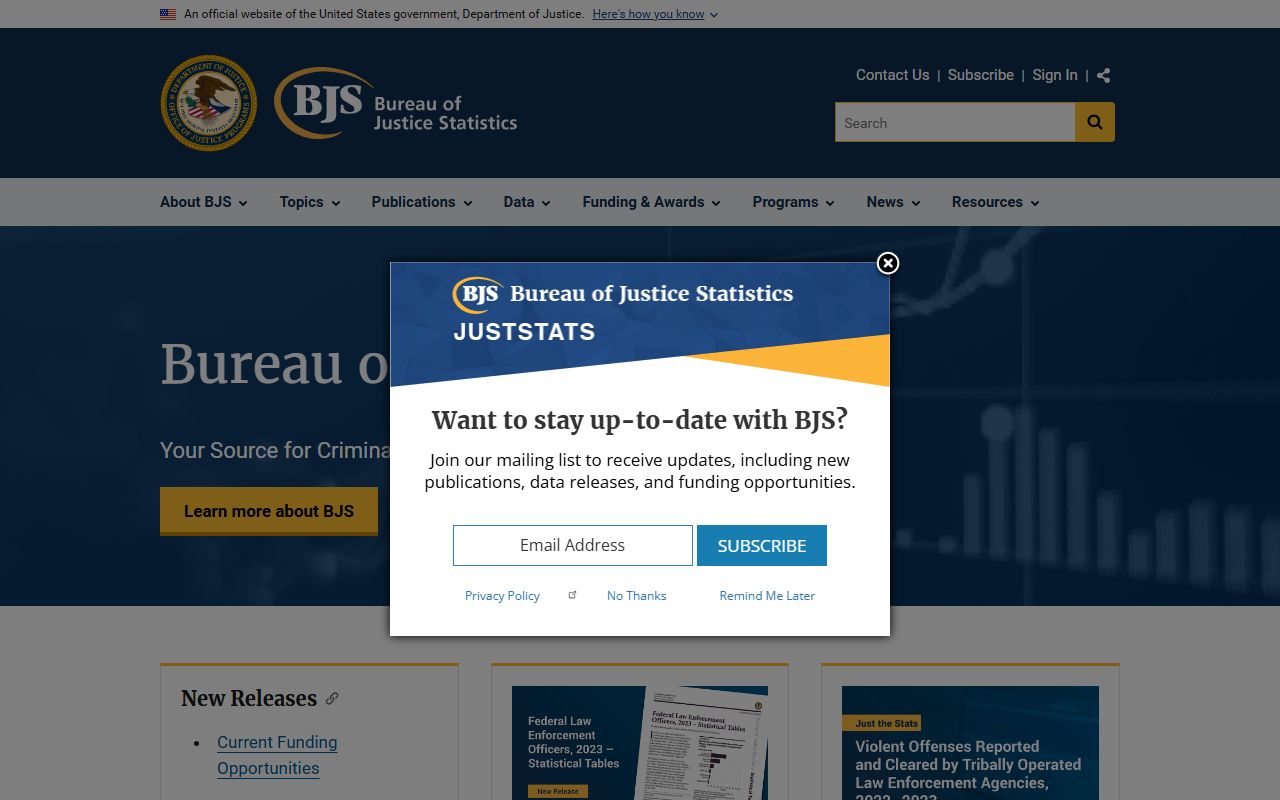
BJS reports give the cleanest national jail rate per 100,000 and the cleanest year-over-year change. Researchers use BJS as the baseline before pulling local Sheriff numbers.
Prison Policy Initiative tracks state-level mass incarceration data at prisonpolicy.org.
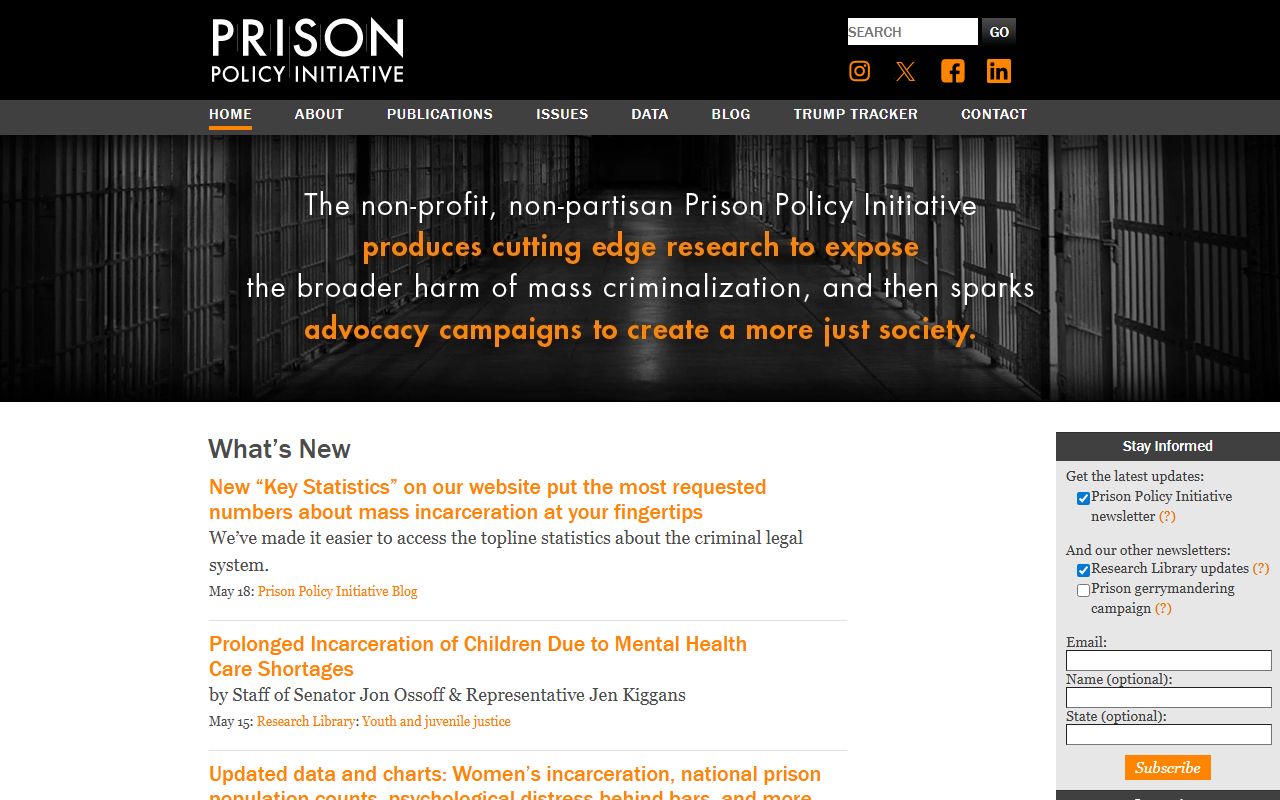
Prison Policy is the best source for California-wide context. The group reports total state and local incarceration counts and breaks them down by status, race and offense type.
| Level | Jail Population per 100,000 (reference) |
|---|---|
| San Bernardino County | Local rate not published; research gap |
| California (state-level) | ~170-180 (Vera/BJS state estimate) |
| National | ~200-210 (BJS Annual Survey of Jails) |
The state-level California rate runs below the national rate, in part because of realignment and pretrial reform. The local San Bernardino rate per 100,000 has not been calculated and posted in the inspected official sources. A rough check using a 5,000 ADP and the county population over 2.1 million residents puts the local jail population near the state range, but that is a back-of-envelope figure and not an official rate.
Population Trends Over Time
The county jail system grew in steps. Glen Helen opened in 1960 as a work camp and later added expanded female inmate housing. Central Detention Center opened in 1971 and expanded in 1974 and again in 1990. West Valley Detention Center opened in 1991 as one of California's largest county jails. High Desert came later to serve the desert region. The current 7,400-bed total reflects six decades of build-out across four sites.
Vera and BJS data show that California county jail populations rose through the 1990s and 2000s, then shifted after 2011 realignment under AB 109. Some counties saw jail counts rise as state prison populations fell. San Bernardino County has held an ADP near 5,000 for a number of years, with bookings near 85,000 per year. Single-year swings in the local count are driven by court backlog changes, pretrial release rule changes and federal contract bed use at Central.
The Federal Bureau of Prisons inmate locator is the parallel source for federal custody at bop.gov.
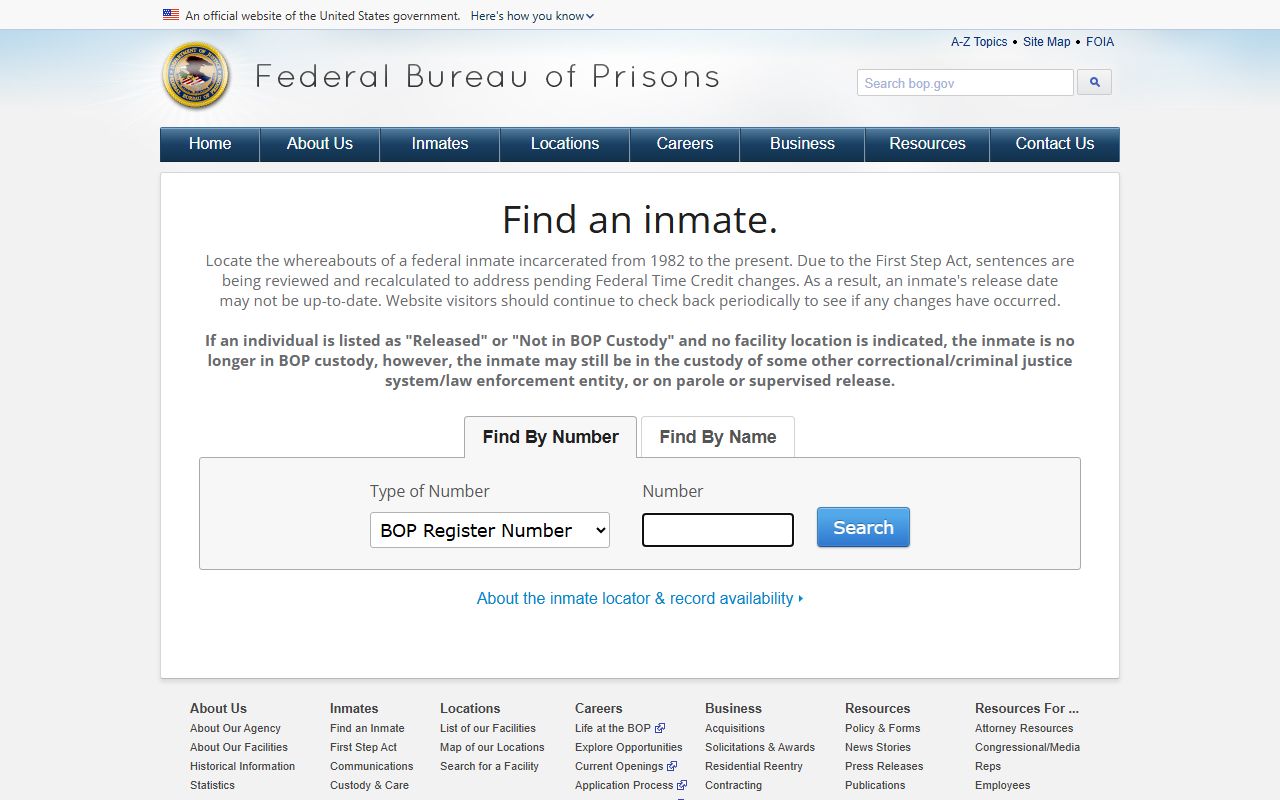
People held on federal charges at Central Detention show in the BOP locator after transfer, not in the Sheriff locator. The two systems do not share a single dashboard.
Searching for San Bernardino County Inmate Records by Name
This page covers aggregate jail population data, not individual lookups. Name searches and booking-number lookups run through the Sheriff inmate locator. For the live roster and profile fields, see San Bernardino County inmate records.
Where the Data Comes From
Four sources sit behind the numbers on this page. The first is the San Bernardino County Sheriff's Detention and Corrections Bureau, which publishes facility counts, ADP and annual booking totals on its corrections pages. The second is the Bureau of Justice Statistics Annual Survey of Jails and Census of Jails, which produce county-level data with a one to two year lag. The third is the Vera Institute incarceration trends dataset, which turns BJS data into long-running county trend charts. The fourth is Prison Policy Initiative, which reports state-level California totals and rates.
For federal inmates, the Federal Bureau of Prisons locator is the official source. The California Department of Corrections and Rehabilitation runs CIRIS for state prison inmates, who do not appear in county jail counts. Each source has its own update cadence, so a side-by-side check across all four can flag short-term changes in the local jail count.